Richest Counties in Michigan (2026)
by Kristen Carney
Updated: February 9, 2026
Richest County in Michigan
The richest county in Michigan is Leelanau County with an average household income of $136,818 as of 2024 and 22,734 people as of 2024 according to the most current Census data available (citation).
| Rank | County | Population | Average Income | Median Income |
|---|---|---|---|---|
| 1 | Leelanau County | 22,734 | $136,818 | $99,422 |
| 2 | Oakland County | 1,279,825 | $134,116 | $97,760 |
| 3 | Livingston County | 195,833 | $129,901 | $103,039 |
| 4 | Washtenaw County | 369,822 | $124,712 | $89,180 |
| 5 | Ottawa County | 301,203 | $115,371 | $90,502 |
| 6 | Clinton County | 79,626 | $112,690 | $88,210 |
| 7 | Emmet County | 34,125 | $109,768 | $78,112 |
| 8 | Kent County | 663,150 | $109,612 | $82,631 |
| 9 | Grand Traverse County | 96,166 | $105,300 | $81,647 |
| 10 | Charlevoix County | 26,108 | $104,936 | $76,531 |
| 11 | Midland County | 83,757 | $104,160 | $77,705 |
| 12 | Allegan County | 121,456 | $103,889 | $83,283 |
| 13 | Barry County | 63,409 | $102,948 | $77,500 |
| 14 | Kalamazoo County | 262,375 | $100,193 | $72,532 |
| 15 | Macomb County | 879,853 | $98,851 | $77,837 |
| 16 | Benzie County | 18,310 | $98,649 | $74,834 |
| 17 | Monroe County | 155,505 | $98,107 | $77,335 |
| 18 | Eaton County | 109,130 | $96,970 | $79,597 |
| 19 | Lapeer County | 88,837 | $96,678 | $77,306 |
| 20 | Cass County | 51,520 | $95,850 | $70,443 |
Median Income versus Average Income: Which Should You Use?
We usually suggest using median income data – either instead of or in addition to – average income data as a true indicator of wealth. If you haven’t thought about median versus average since your last standardized test, you aren’t alone. Here’s what they are:
- average is the sum of a set of numbers divided by the count of numbers in the set
- median is the middle number in the set of numbers
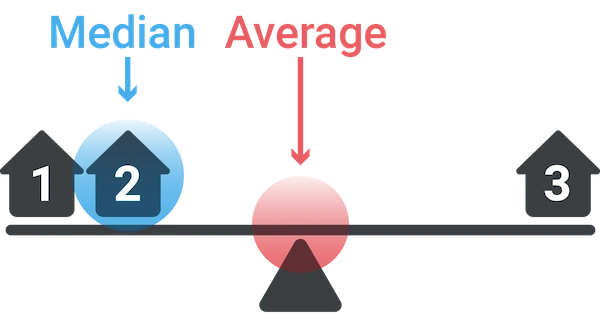
Now let’s say you had the following simplified set of income data.
Household 1: $30,000
Household 2: $50,000
Household 3: $1,000,000
The average income for this set is $360,000. The outlier data point ($1,000,000) skews the average WAY up. Conversely, the average income would be skewed WAY down if someone had an income of $500. The median income for the same data set is $50,000. Outlier data doesn’t skew the median.
Most Business Owners Should Use Median Income
So most business owners should use the median income as a true indicator of wealth, because it provides a more accurate representation of a typical income, especially in areas with significant income disparity.
When Should You Use Average Income
If your target market is high-income households, the average income may be more relevant. This is because the average income can highlight the presence of a higher concentration of wealthy individuals, which is beneficial for luxury goods and services marketing. We’re using average income on this page because using the Census’s highest reported median value of $250,001 could result in multiple ties for the richest geography.
Why do so many cities have a median value of $250,001?
The Census' American Community Survey uses $250,000+ as a jam value for median income estimates to protect privacy, ensure data consistency, and simplify reporting. A "jam value" in survey data refers to a placeholder or default value used when actual data points are unavailable, incomplete, or exceed certain thresholds. We represent this jam value as $250,001 to make it easy for you to sort.
You might also be interested in:
Email Me When New Data Are Released
Join thousands of subscribers and receive just 1 (ONE!) email a year in December when the US Census Bureau releases new income data for Michigan richest counties.
SOURCES
United States Census Bureau. Annual Estimates of the Resident Population: April 1, 2020 to July 1, 2024. U.S. Census Bureau, Population Division. Web. May 2025. http://www.census.gov/.
United States Census Bureau. B01001 SEX BY AGE, 2024 American Community Survey 5-Year Estimates. U.S. Census Bureau, American Community Survey Office. Web. 29 January 2026. http://www.census.gov/.
United States Census Bureau. B19013 Median Household Income, 2024 American Community Survey 5-Year Estimates. U.S. Census Bureau, American Community Survey Office. Web. 29 January 2026. http://www.census.gov/.
United States Census Bureau. “DP03 SELECTED ECONOMIC CHARACTERISTICS.” 2024 American Community Survey 5-Year Estimates. U.S. Census Bureau, American Community Survey Office. Web. 29 January 2026. http://www.census.gov/.
Products & Services
Plumbing
Connect
- 1-800-939-2130
- Contact Us
© Copyright 2026 Cubit Planning, Inc.